Intro
Assets such as stocks, ETFs, indexes, options, derivatives, commodities, currencies, cryptocurrencies and their tokens, bonds, fixed-income securities, and Real Estate Investment Trusts (REITs) are almost always evaluated based on their Last Price. This approach is seen everywhere: in news reports, academic papers, financial systems, laws, and regulations. Most financial market graphs show only the last price for an interval. Yet we rarely ask whether the Last Price is the best measure for every situation. Could relying on it lead to misleading conclusions when it is applied to the wrong problems?
Consider a simple example: a stock trades steadily at 100 dollars throughout the day, with a total volume of one billion shares. Then, in the very last trade of the day, just one thousand shares exchange hands at 40 dollars. Market reports would claim a 60 percent drop (from 100 to 40), even though this final trade was unrepresentative of the broader market activity, and overall, the market had barely moved.
Using the Last Price as the "representative" market measure in all situations can lead to several problems:
Last Price Overuse Causes Investor Overreactions
-
Amplifies Short-Term Noise:
Many investors, especially retail traders, react emotionally to price movements. Treating short-term fluctuations as if they are meaningful trends can trigger impulsive decisions.
Example: A stock closes at 100 dollars, then a single investor buys just one share at 105 dollars. This minor purchase can suggest a sudden “5 percent increase,” even though there was almost no volume supporting it. -
Misleading After-Hours Price Gaps:
During after-market and pre-market hours, trading volume is usually low, so small trades can create large shifts.
Example: A stock that closes at 50 dollars might see a final after-hours trade at 40 dollars. With so few shares trading hands, the plunge is not truly representative of the market’s view, yet it might alarm investors.
Last Price is an Unstable Foundation
The Last Price is an unstable basis for important
- market processes such as margin calls, limit orders, stop-loss orders, valuations of funds, Net Asset Value (NAV) calculations, earnings reports and year-end financial reports.
- legal processes such as taxes, laws and regulations, asset separations (like a divorce or company partner departure).
However, since the Last Price can be volatile, manipulated, or out of sync with the broader market, it can mislead investors, stakeholders, governments, and financial institutions.
-
Stop-Loss Triggers from Low-Volume Trades:
A small, low-volume trade below an investor’s stop-loss threshold may trigger an unwanted sale, even though the broader market still values the asset above that level.
-
End-of-Year Valuation Distortions:
Near fiscal year-end, a brief dip in an asset’s price can reduce a company’s or fund’s official valuation. This can lead to:
- Skewed Financial Statements: Firms appear less valuable than they truly are.
- Incorrect Taxation: Investors and corporations may pay the wrong capital gains taxes.
- Investor Misperception: Funds pegged to NAV seem weaker due to last-minute pricing anomalies.
Last Price Overuse Increases Market Volatility
-
Self-Fulfilling Price Swings:
Because many trading tools—margin calls, limit orders, and stop-loss orders—react to the last traded price, rapid shifts in that price can trigger chain reactions.
Example: If a temporary drop activates countless automated sell orders, it can spark a cycle of additional price drops, known as cascading liquidations. -
Flash Crashes and Panic Selling:
Some flash crashes happen when algorithmic trading and limit orders respond to short-lived price dips.
Example: In the 2010 Flash Crash, high-frequency trading and triggered stop-loss orders caused the Dow Jones to lose about 9 percent in minutes before quickly recovering.
Last Price Overuse Makes Markets Easy to Manipulate
-
"Painting the Tape":
A trader or institution can place several small orders at misleading prices to make an asset look stronger or weaker than it is.
Example: A trader who wants to boost a stock’s price before an earnings report might buy tiny batches of shares at slightly higher prices to imitate strong demand. -
Marking the Close:
Since closing prices guide institutional valuations, some entities strategically place orders near the market’s close to affect that final price.
Example: A hedge fund wanting to improve quarterly returns could submit a major buy order in the last seconds of trading, pushing the closing price higher to reflect better performance. -
Manipulating Stock Options and Derivatives:
Options often settle based on the Last Price. A trader who holds many option contracts can push the final price to gain a profitable outcome.
Example: An investor holding several 50-dollar call options might buy shares aggressively near the close, driving the price above 50 dollars so that the calls expire in the money.
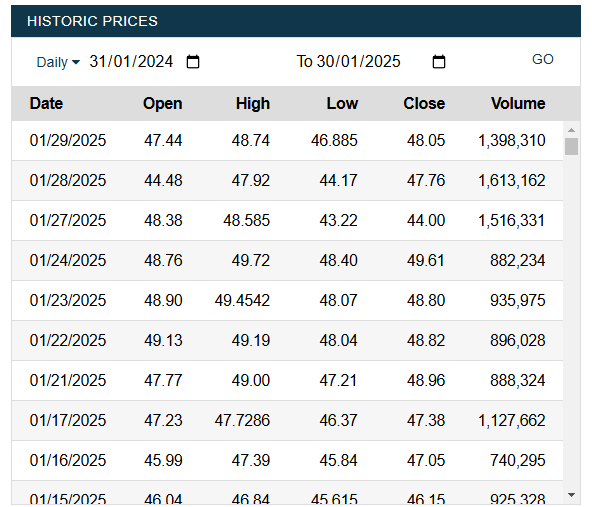
Unfortunately, most exchanges worldwide provide the public with free access only to the Last Price during market hours. After the market closes, they publish daily data, including the closing price, which is simply the last trade of the day. For example:
In most cases, mandatory financial reporting to the public has remained unchanged for decades, despite the rise of new technologies that could provide more accurate and comprehensive data. Meanwhile, modern financial tools—such as margin calls and limit orders—have been built around these outdated metrics, often misapplying them in ways that can trigger serious market disruptions.
To illustrate the absurdity of this approach, imagine a business owner asking for a breakdown of customer spending habits. Instead of providing meaningful insights, an employee responds with just four numbers: how much the first customer spent, how much the last customer spent, and the highest and lowest amounts spent. This would be an incomplete and unintuitive way to analyze sales—yet this is exactly how financial markets report asset prices, relying on a few arbitrary points instead of a more sophisticated and scientifically sound representation of market activity.
Solution part 1: Mean Price
A more sensible default market metric for most situations is the Mean Price, where volume weighting is the only logical approach and is therefore implied. This metric, also known as the Volume-Weighted Average Price (VWAP), is widely used in technical trading, often calculated daily but applicable to any timeframe. For simplicity, memorability, and effective communication, we will refer to VWAP simply as Mean Price.
Mean vs Average
The term "average" is an informal term that can refer to various statistical measures, including the arithmetic mean (which we will be using), but also the median, mode, geometric mean, or harmonic mean. The term "mean" is more precise in statistics and is therefore preferable whenever possible to avoid confusion.
Although we learned how to calculate the weighted mean in primary school, we seem to have forgotten to use that skill where it matters most. Let us now calculate it for the earlier example involving the misrepresented asset:
Reporting the Mean Price (or rounding it to 100 dollars) is the most reliable default price for public reporting, charts, and analyses. It would have clearly shown that there was no crash and very little volatility.
This does not mean the Last Price is useless—it can still be relevant for immediate trades. However, a more informed approach would be to consider the Last Price alongside a short-term Mean Price, such as one calculated over the past ten minutes or one hour, for better decision-making.
Most stock exchanges do not provide Mean Price data to the public, either as part of free information packages or even within paid data services. As a result, many companies must calculate Mean Price independently by subscribing to premium feeds that reveal every executed trade—an often expensive process. Some financial data providers, such as Bloomberg and Refinitiv, include Mean Price as part of their premium offerings.
However, modern streaming (or "online") data technologies, such as the Open Source Apache Spark, which many exchanges likely already use in one form or another, make it simple and cost-effective to calculate Mean Price in real time as trades take place.
In essence, new financial reporting standards are needed to address modern financial risks and to take advantage of new technological possibilities. Consider the following points:
- The Last Price is frequently misused by the media, the general public, goverments and financial markets, leading to overreactions and market volatility.
- This misuse creates opportunities for manipulation and undermines trust in markets.
- Reporting requirements have not evolved, even though technology and financial tools have advanced and created fresh needs and possibilities.
- Providing more detailed or alternative statistics is now inexpensive and computationally straightforward.
We propose a new regulation or law requiring exchanges with all publicly traded assets to disclose Mean Price to the public at no cost, in a format easily accessible to both humans and machines.
Any exchange that displays Last Price—such as financial graphs, stock market web pages, and daily reports—must also display Mean Price alongside it, or let the user choose between Last Price and Mean Price.
Solution part 2: Per-Minute Reporting
In addition to adding Mean Price to current reporting, we propose a new reporting requirement for exchanges: publishing an aggregated summary per asset, similar to existing daily reports, but at one-minute intervals. This means that for each minute within the last two hours of trading, exchanges must update and publish this data every minute.
Below is an example with made-up data for a volatile asset:
| Minute | Open price (first trade) |
Mininum price (lowest trade) |
Maximum price (highest trade) |
Close price (last trade) |
Volume (Σ Volume) |
Mean Price |
|---|---|---|---|---|---|---|
| 2025-01-27 09:03 | $92.61 | $67.17 | $110.63 | $83.56 | 3,149 | $89.70 |
| 2025-01-27 09:02 | $120.10 | $76.77 | $106.25 | $93.03 | 3,083 | $101.00 |
| 2025-01-27 09:01 | $119.81 | $91.20 | $142.74 | $120.29 | 2,897 | $92.00 |
| 2025-01-27 09:00 | $121.57 | $100.71 | $145.41 | $119.73 | 2,977 | $142.93 |
| 2025-01-24 16:59 | $98.06 | $83.91 | $134.83 | $89.51 | 2,878 | $84.02 |
| 2025-01-24 16:58 | $93.87 | $90.91 | $95.55 | $98.51 | 3,005 | $95.10 |
| ... and so on, 114 more times, to account for each minute of the 2h sliding window. | ||||||
1: This data reflects the most recent two hours of active trading time, not the last two hours by the clock. For example, if an exchange closes for the weekend, then in the first 15 minutes of trading on Monday, we would only see data for those 15 minutes. The following 105 minutes would represent the final part of Friday’s trading.
2: Another key detail is that if no trades occur during a particular minute, that minute must still be listed. The relevant columns would show “N/A,” while Volume would be recorded as zero. This information highlights low liquidity or possible market uncertainty.
This style of reporting may seem unconventional at first. Why record data by the minute, and why only for the last two hours? The reason is that modern systems can capture and store this information almost instantly, making minute-by-minute reporting feasible. The two-hour window strikes a balance between providing timely insights and avoiding excessive data storage burdens on exchanges. It ensures a reasonable margin of safety for data consumers while keeping implementation practical.
Why Mean Price and Per-Minute Reporting?
- Data Minimization: Providing full order book snapshots or tick data would offer more insights, but it would also generate an overwhelming volume of data for both providers and consumers. Mean Price and per-minute reporting strike a balance between simplicity and completeness, significantly reducing the data exchanges need to publish while still offering valuable insights.
- Aggregation & Modularity: This structured data can be aggregated over any time frame—hours, days, weeks, months, or years—allowing for flexible analysis. It serves as a modular foundation for building additional financial metrics, including: Turn Over, Turn Over relative to Market Value, Mean-Based Bollinger Bands, Volatility & Dispersion Metrics, Improved Risk & Statistical Measures, and Undoubtedly many others will be created
- Transparency & Fairness: Per-minute data enables retail traders to get a more accurate sense of the market, helping them allocate resources more efficiently. It also reduces the perception that financial markets are designed to benefit only large players, fostering greater trust and market fairness.
Replacing Last Price with Mean Price and other metrics can better serve different market objectives. For example, a more sophisticated limit order could be designed to execute only if the last 10-minute Mean Price drops below a certain threshold while the volume remains consistent with the daily Mean.
This shift moves us beyond black-and-white thinking and toward a more sophisticated, context-driven approach—one that asks: “Which price measure is the most representative for this particular situation?”
Avoiding Central Planning
We should resist the temptation to centrally plan industries or societies, as it often leads to more mistakes than truly informed decisions. No one should be forced to use the newly available data. The media can continue reporting Last Price if they choose, and financial firms can still rely on it for margin calls, options, trade limits, and other automated processes.
However, over time, most market participants will likely adopt more sophisticated metrics such as Mean Price, unlocking a wide range of efficiency and transparency benefits.
Mandating that exchanges publish new data falls squarely within the government's role of enhancing transparency—giving the public access to better information for smarter decision-making. This is a stark contrast to laws that attempt to micromanage markets, as it simply empowers individuals and institutions with better tools rather than dictating how they must use them.
Are There Any Downsides to These Suggestions?
While Mean Price is a more robust and reliable measure than Last Price, it is not without limitations and may not be suitable for every situation. Similarly, Per-Minute Reporting may introduce new challenges that need careful consideration.
Let us explore some common concerns, answering them through: clarifying misunderstandings, proposing potential solutions, identifying ways to mitigate risks and minimize negative impacts.
Not Ideal for Real-Time Trading Decisions, Distortions in Illiquid Markets, Fear of Misinterpretation, New Opportunities for Manipulation
Concerns:
- In fast-moving markets, traders may still need Last Price for immediate decision-making.
- If a market has large gaps between trades or low volume, Mean Price may still be misleading—especially in the short term.
- If some brokers show Last Price while others use Mean Price, retail traders may get confused.
- Bad actors might time trades strategically to artificially manipulate Mean Price in the short term, influencing Per-Minute Reporting, particularly in illiquid markets.
- Retail traders may over-rely on Mean Price or short-term Per-Minute data without considering bid-ask spreads, real liquidity depth, or larger market trends.
- A smooth-looking Mean Price may mask sudden liquidity events, making it harder to detect market stress signals (e.g., liquidity drying up before a crash).
- Market anomalies like spoofing, wash trading, or flash crashes might become harder to detect in the new dataset.
- If traders focus too much on Mean Price instead of market momentum, price discovery could slow down, leading to less efficient markets.
- Market participants can continue using Last Price if it suits their needs—Mean Price and Per-Minute Reporting are additional tools, not replacements.
- While no market metric is immune to manipulation, Mean Price is significantly harder to distort (compared to Last Price) because it requires substantial trading volume to meaningfully shift.
- Brokers, exchanges, financial advisors, books, and influencers can educate traders on when and how to use different market metrics effectively.
- Regulators and exchanges can coordinate a standardized approach to displaying multiple price types together, reducing confusion.
- Brokers and financial platforms can introduce indicators like "Reliability Scores" (e.g., red, yellow, green) based on volume strength, recent Mean Price stability or other market health indicators. These enhancements would help traders avoid manipulation traps and make more informed decisions, without limiting their freedom.
Exchanges Considerations
Concerns:
- Exchanges generate substantial revenue by selling detailed market data to institutional clients. They may resist providing valuable insights for free.
- Some traders profit from small price movements and spread inefficiencies. If new data available to the public reduces these opportunities, they may lobby against its implementation.
- While exchanges might experience a minor reduction in market data sales, the impact is likely negligible because they already sell much more granular data (e.g., order book depth, historical tick data, and advanced statistics) in premium services.
- Exchanges benefit from a market that is less volatile and harder to manipulate, as it attracts more participants and builds trust in the financial system. Increased credibility and transparency can lead to higher overall trading activity and long-term exchange revenue growth.
- Modern technology makes implementation costs relatively low, making this a cost-effective upgrade rather than a financial burden.
- More transparent market conditions could pave the way for the expansion of publicly traded assets. Currently, only large companies list on major exchanges, in part due to liquidity constraints. With better tools to manage low-liquidity assets, medium-sized companies could gain a dedicated section of the market, increasing market participation and exchange revenues.
Added uncertainty and complexity
Concerns:
- Last Price is deeply ingrained in market / legal infrastructure. Using Mean Price or other metrics
may be disruptive.
- Market infracstructure such as trading platforms, financial advisors and media, and portfolio managers would need to adjust algorithms, dashboards, and reporting tools, creating logistical costs and risks of mistakes.
- Legal infracstructure such as Many laws, particularly securities regulations & tax codes, assume Last Price is the default reference. Updating them would take time & coordination.
- Mean Price not black and white like Last Price, Different situations may call for different timeframes (e.g., 10min, 30min, 1 day, 3 days), increasing complexity.
- Mean Price does not need to replace Last Price immediately—it can be introduced as an optional metric at first.
- As different market participants transition to Mean Price, they can educate their users on why and how it improves decision-making. Example: If a brokerage firm reconfigures margin calls to use a 30-minute Mean Price instead of Last Price, it can publicly explain why that timeframe was chosen and how it benefits traders.
- Governments & exchanges can gradually phase in Mean Price requirements, first applying them to specific markets or asset classes, before expanding its use across the financial system.
- Regulators and tax authorities can define specific Mean Price timeframes for certain financial needs. Example: Tax calculations might use the 30-day Mean Price at the end of the financial year rather than relying solely on the Last Price at a single moment in time.
- Selecting appropriate timeframes is an added layer of complexity, but it is useful and necessary to create a more transparent, resilient, and fair financial system. Markets should be responsive—but not overly reactive. Choosing the right timeframes helps strike this balance.
- Market simulations and backtesting can determine the most effective Mean Price timeframes for various use cases such as trading, valuation, and risk management scenarios. This ensures that the right tool is used for the right job, improving overall market efficiency.
Second Wave of Data Requirements
Once these initial data requirements are successfully implemented, a second wave of additional data can be considered. However, further studies are needed to determine which data points best represent the market while maintaining a balance between:
- Minimalism vs. Data Overload
- Ease of Computation
- Aggregability Across Different Time Frames
- Composability for Creating More Advanced Metrics
Below are some initial suggestions for future improvements—an optional read, only for curious readers:
Exchanges could also include this additional data in their daily and per-minute reports, providing deeper insights into market activity:
- Volume: The total number of assets traded. (This is already published by most exchanges in their daily reports)
- Mean Price: The mean or average price, which can be used to calculate Turn Over and Turn Over relative to market value.
- 2nd Unstandardized Central Moment (2UCM): This measures how spread out the prices are around the daily mean (also known as Variance). It can be used to calculate the Standard Deviation (the square root of the variance), indicating how spread out the values are.
- 3rd Unstandardized Central Moment (3UCM): This measures the asymmetry of the price distribution. It can be used to calculate Skewness, which shows whether the data is lopsided
- 4th Unstandardized Central Moment (4UCM): This measures the "tailedness" of the price distribution (how often extreme prices occur). It can be used to calculate Kurtosis, which indicates whether there are many extreme values.
If the reader is more of a visual learner, they can learn more about the Normal Curve, Standard Deviation, Modality, Skewness and Kurtosis in this youtube video.
Explanation of Technical Terms: Readers do not need to grasp every mathematical detail—a high-level conceptual understanding is sufficient. The following terms and formulas are well-established in statistics and help clarify key concepts discussed:
- Moment: A moment describes the shape of a probability distribution. It is a way to capture different aspects of how the data is spread out.
- Central Moments: These describe the distribution's shape relative to its mean. To calculate a central moment, one takes the difference between each data point and the mean, raises that difference to a certain power, and then averages these values.
- Unstandardized vs. Standardized: Unstandardized Moments are the "raw" moments, their units depend on the original data (e.g., if the price is in dollars, the 2UCM will be in dollars squared). Standardized Moments are obtained by dividing the central moment by a power of the standard deviation, which removes the units and allows for comparison across different scales or assets. We use unstandardized moments because they retain raw information for further calculations and can be standardized later when needed.
Pros and Cons
- Data Minimization: It reduces the amount of data that exchanges need to publish compared to providing full order book snapshots or tick data, which would indeed provide more insights, but also would be a massive amount of data for providers and consuemrs to deal with. These metrics provide a balance between simplicity and completeness.
- Completeness: These data points supply all the necessary information to calculate the volume-weighted mean, variance, standard deviation, skewness, and kurtosis accurately. They also allow calculation of additional useful metrics such as Turn Over, Turn Over relative to Market Value, Coefficient of Variation, risk-adjusted return metrics (e.g., Sharpe Ratio, Sortino Ratio), and mean Bollinger Bands.
- Aggregation & Modularity: This data can be aggregated to compute metrics over any time frame—hours, days, weeks, months, or years. Provides a modular foundation for building more advanced financial indicators.
- Not a Normal Distribution: Most financial research agrees that trading data does not follow a normal distribution. While the above metrics are useful, they must be applied with caution, ensuring they are not misused in inappropriate contexts where non-normal price behavior distorts results.
Another useful set of metrics is percentiles (weighted by volume). These provide deeper insights into market behavior. The following percentiles could be included in daily and per-minute reports: 10th, 25th, 50th (median), 75th, 90th.
Pros and Cons
- Outliers: Percentiles provide an alternative perspective on the market, particularly useful for identifying outliers and extreme price movements.
- Complementary Insights: Percentiles can supplement other indicators, offering guidance on market distribution characteristics (e.g., skewness, kurtosis) and helping determine which statistical models or indicators are most appropriate.
- No Aggregation Across Time Frames: Unlike mean-based metrics, percentiles from minute-level reports cannot be aggregated to create metrics for longer time frames (e.g., hours, weeks, months).
- Computational Complexity: Percentiles cannot be calculated using streaming algorithms with high precision. Instead, they require processing all price data at the end of a given period, making them more computationally expensive than previously suggested metrics.
Regulators may consider requiring additional metrics, such as: Algorithmic Trading Activity, Mean Ask-Bid Spread Per Minute, Number of Unique Buyers and Sellers, Number of Trades, Types of Traders (market vs. limit orders), Types of Traders (institutional vs. retail), Order Book Imbalance (the ratio of buy volume to sell volume)
However, we have not recommended these here, as their inclusion would require further analysis to prevent manipulation risks and unnecessary complexity.
In summary, more research is needed to identify additional effective market metrics that are widely applicable, simple, and resistant to manipulation. However, this effort should not delay the implementation of more straightforward and clearly necessary changes, such as:
- Introducing Median Price as a key market metric
- Enhancing reporting granularity with per-minute data
Fortunately, additional metrics can be introduced later, in a second wave, once the first phase is successfully implemented. These future enhancements will create strong synergy with the foundational changes (like per-minute reporting), leveraging the new data infrastructure for further market improvements.
Conclusion
Relying on Last Price as the primary metric for assessing market conditions is a fundamental mistake. It is akin to the old saying: "If all you have is a hammer, everything looks like a nail." This over-reliance leads to resource misallocation, investor overreactions, increased market volatility, and greater susceptibility to manipulation.
In contrast, Mean Price is a more sophisticated, flexible, and resistant-to-manipulation metric. When combined with Per-Minute Reporting, it enhances financial transparency, levels the playing field between retail and institutional investors, and improves data composability—allowing it to serve as a foundation for more advanced financial and technological tools.
By providing a more accurate reflection of market activity, Mean Price and Per-Minute Reporting enable better decision-making, improved resource allocation, and reduced risks associated with misinterpreting price movements.
A key example of an improved financial tool leveraging these principles will be introduced in a future article.